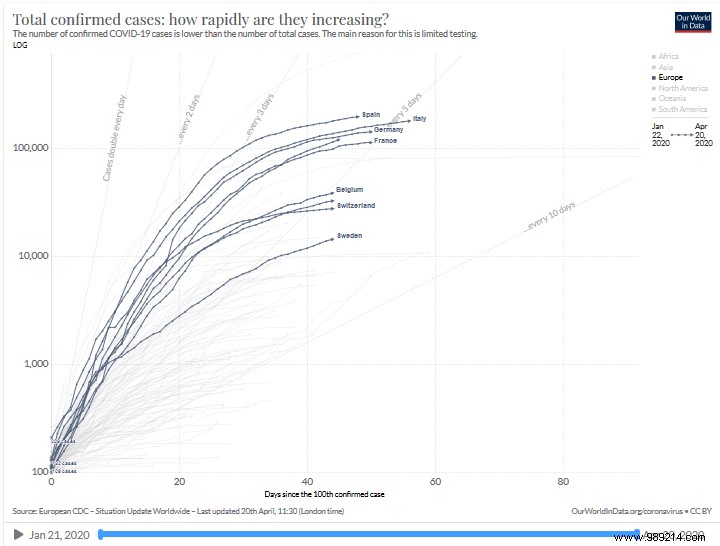
Published a month ago, an interactive and flexible graph shows the curves of the Covid-19 pandemic in affected countries . Updated daily, it allows you to make many comparisons.
Today, the global toll of the Covid-19 pandemic reports nearly 2.5 million cases for more than 170,000 deaths . The dashboard of Johns Hopkins University (United States) makes it possible to follow the balance sheet on a daily basis. However, another document can supplement it. This is a graph published on March 16, 2020 on the Visual Capitalist platform developed using data published by the European Center for Disease Prevention and Control (ECDC).
The chart in question is updated daily with new data. In addition, a tab allows you to select several countries to compare. It is also possible to view all the countries of the same continent. After a quick test (see below), it is possible to realize that Italy, Spain, France and Germany follow practically the same curve.

In passing, remember that these curves concern only the number of Covid-19 cases by country from December 31, 2019. However, we regret the absence of a curve showing the evolution of the number of deaths.
Visual Capitalist's post also reminds of the danger of "doubling rate". This is when the number of patients exceeds the capacity of health systems . However, it is useless to recall to what extent European health services are being undermined. It is for this reason in particular that a potentially rapid evolution of the number of cases in Africa is a source of great concern. If even the rich countries see their health system abused in this way, what about the African continent where the means are very limited?
Thus, each country tries to prevent and delay the spread of the virus . The objective is naturally to prevent a large part of the population from being sick at the same time. As everyone knows, this requires the adoption of various measures applied to different degrees depending on the country. These include social distancing, working from home, closing schools and other institutions. There are also restrictions on the number of people in the case of gatherings. The strictest method is undoubtedly the confinement of the population, which as everyone knows is currently in force, particularly in France.
Here is the interactive graphic: